
 SPSS for Starters and 2nd Levelers
by
A complete overview of SPSS methodologies for medical and health statistics. Medical and health professionals tend to dislike software syntax. Therefore, virtually no syntax, but, rather, simple menu commands are given. The arithmetic is...of a no-more-than high-school level. Step-by-step analyses of different statistical methodologies are given with the help of 60 SPSS data files available through the internet. Because of the lack of time of this busy group of people, the authors have given every effort to produce a text as succinct as possible.
SPSS for Starters and 2nd Levelers
by
A complete overview of SPSS methodologies for medical and health statistics. Medical and health professionals tend to dislike software syntax. Therefore, virtually no syntax, but, rather, simple menu commands are given. The arithmetic is...of a no-more-than high-school level. Step-by-step analyses of different statistical methodologies are given with the help of 60 SPSS data files available through the internet. Because of the lack of time of this busy group of people, the authors have given every effort to produce a text as succinct as possible.
Cropper, C. 1977. "Recovery of Patients from Stroke." OzDASL – Australasian Data and Story Library. Accessed from http://www.statsci.org/data/oz/stroke.html on Dec. 15, 2015.
Essenberg, C. J., R. A. Easter, R. A. Simmons, and D. R. Papaj. 2015. The value of information in floral cues: bumblebee learning of floral size cues. Unpublished raw data.
Hanley, J. A., and Shapiro, S. H. 1994. Sexual Activity and the Lifespan of Male Fruitflies: A Dataset That Gets Attention. Journal of Statistics Education 2(1). Accessed from http://www.amstat.org/publications/jse/v2n1/
Rasmussen, Marianne. "Activities of Dolphin Groups." OzDASL – Australasian Data and Story Library. Accessed from http://www.statsci.org/data/general/dolpacti.html on December 15, 2015.
Wilson, Richard J. "Pulse Rate Before and After Exercise." OzDASL – Australasian Data and Story Library. Accessed from http://www.statsci.org/data/oz/ms212.html on December 15, 2015.
Analyze > Nonparametric Tests > Legacy Dialogs > Binomial
 Requires one variable with two values, and an expected proportion. In SPSS, the variable must be stored as a numeric type and either nominal or scale measure.
 If the data are available only as a frequency table, and not as a column with values as shown above, you will have to enter the data as a weighted table, with one categorical (numeric) variable and a count (integer) variable containing the frequency. The table will have two rows, one for each of the two values. See instructions for applying the frequency weight for your table.
Analyze > Nonparametric Tests > Legacy Dialogs > Chi Square
Requires one categorical variable with values of expected frequencies. In SPSS, the variable must be stored as a numeric type and either nominal or scale measure.
If the data are available only as a frequency table, and not as a column with values as shown above, you will have to enter the data as a weighted table, with one categorical variable and a count (scale) variable containing the frequency. The table will have two rows, one for each of the two values. See instructions for applying the frequency weight for your table.
Analyze > Descriptive Statistics > Crosstabs
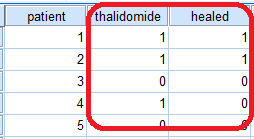 Requires two categorical variables, with two or more possible values.
 If the data are available only as a frequency table, and not as a column with values as shown above, you will have to enter the data as a weighted table, with two categorical (numeric) variables and a count (integer) variable containing the frequency. The table will have one row for each possible combination of the two categorical variables; for example, if both categorical variables have three possible values, there will be 9 (3 x 3) rows. See instructions for applying the frequency weight for your table.
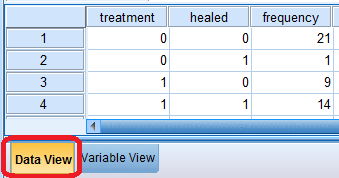
Analyze > Descriptive Statistics > Crosstabs
 Requires two categorical variables with two possible values each.
If the data are available only as a frequency table, and not as a column with values as shown above, you will have to enter the data as a weighted table, with one categorical variable and a count (integer) variable containing the frequency. The table will have four rows, one for each combination of the two variables. See instructions for applying the frequency weight for your table.
Analyze > Compare Means > One-Sample T Test
 Requires one normally distributed numerical variable and a hypothesized mean. See instructions for checking for normality.
Analyze > Nonparametric Tests > Legacy Dialogs > Binomial
Requires one numerical variable and a hypothesized median. The numerical variable does not need to be normally distributed.
Analyze > Compare Means > Independent-Samples T Test
 Requires one normally distributed, numerical variable and one grouping variable with two values. The grouping variable may be numeric-type or string-type. See instructions for checking for normality.
Analyze > Compare Means > Paired-Samples T Test
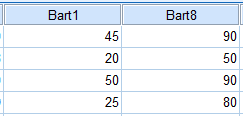 Requires two numerical variables that are paired. Paired samples are matched in some way; often they represent the same object or respondent tested at different points in time.
Analyze > Compare Means > One-Way ANOVA
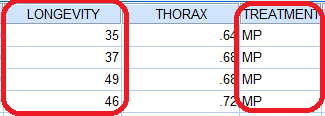
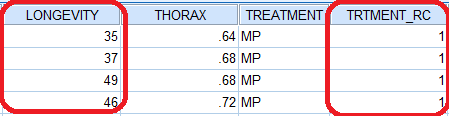
 Requires one normally distributed, numerical response variable and one categorical grouping variable with two or more values. See instructions for checking for normality. Note that the grouping variable must be numeric. If it is a string variable, like TREATMENT in the image below, you will need to create a numeric-type variable using Automatic Recode.
Analyze > Compare Means > One-Way ANOVA
Requires one numerical response variable and one grouping variable with two values. See instructions for checking for normality. Note that the grouping variable must be numeric. If it is a string variable, like TREATMENT in the image below, you will need to create a numeric-type variable using Automatic Recode.
Analyze > General Linear Models > Univariate
 Requires one normally distributed numerical response variable and two categorical grouping variables with two or more values. See instructions for checking for normality. Note that the grouping variable must be numeric. If it is a string variable, like TREATMENT in the image below, you will need to create a numeric-type variable using Automatic Recode.
Analyze > Nonparametric > Legacy Dialogs > 2 Independent Samples
 Requires one numerical or ordinal variable, and one grouping variable with two values. The grouping variable must be numeric. If it's not numeric, use Automatic Recode to create a new numeric variable. The continuous variable does not need to be normally distributed.
Analyze > Nonparametric > Legacy Dialogs > K Independent Samples
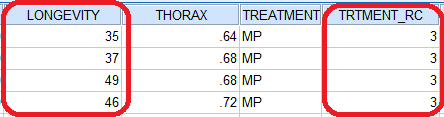
Requires one numerical or ordinal variable, and one grouping variable with two or more values. If it is a string variable, like TREATMENT in the image below, you will need to create a a numeric variable using Automatic Recode.
Analyze > Regression > Linear
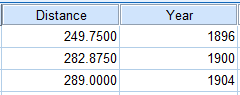 Requires two numerical variables. See also instructions for creating regression plots.
Analyze > Correlate > Bivariate
Requires two numerical variables. See setup for Simple linear regression above.
Analyze > Correlate > Bivariate.
Requires two numerical variables. See setup for Simple linear regression above.
Analyze > General Linear Model > Univariate
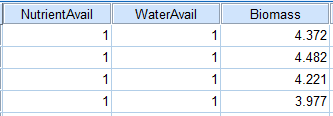
Requires one numerical dependent variable and any combination of independent numerical or categorical numeric variables.

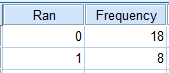
 Navigate to Analyze > Nonparametric Tests > Legacy Dialogs > Binomial. Click on the variable in the left-hand column that you would like to test, and use the arrow in the middle to move it into the Test Variable List. Next to Test Proportion, enter the expected proportion for the variable encountered first--that is, the variable in the first row of data. If your variable is not dichotomous, you can divide it into two groups using the Cut point field under Define Dichotomy.
 The p value is found in the circled area. If the test proportion is not .5, it will give you 1-tailed significance, but it will display in the same place in the output.
 Navigate to Analyze > Nonparametric Tests > Legacy Dialogs > Chi Square. Click on the variable in the left-hand column that you would like to test, and use the arrow in the middle to move it into the Test Variable List. If there are infrequent values you want to remove from your test, you can set a range under Expected Range.
  The p value is found in the circled area.
 Navigate to Analyze > Descriptive Statistics > Crosstabs. Use the arrow in the middle to move one of your categorical variables into Row(s) and one into Column(s).
 Click on the Statistics... button and select Chi-square in the upper left, then Continue and then OK.
 The p value is in the circled area.
 The p value is in the circled area.
 Navigate to Analyze > Compare Means > One-Sample T Test. Move the variable you want to test to the Test Variable(s) list, and enter the expected mean in the field next to Test Value.
 The p value is in the circled area.
 The test requires a hypothesized median, so the first thing to do is remove those cases in which the variable is equal to this hypothesized median. We can do this by going to Data > Select Cases, selecting the variable we will test, checking the button next to "If condition is satisfied," then clicking on the button "If..."
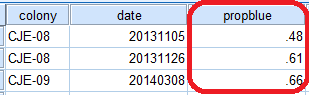
 In this menu, we create an expression for the cases that we want to include. For example, if the hypothesized median for the propblue variable was 0.52, we would enter the expression for propblue is not equal to 0.52, or in SPSS-land, propblue ~= 0.52. You can either type this in the center box, or use the buttons to enter, then click on Continue.
 Now navigate to Analyze > Nonparametric Tests > Legacy Dialogs > Binomial. The rest is the same as the binomial test, with the hypothesized median entered as the cut point, and with a test proportion of 0.5.
 The p value is in the circled area.
 Navigate to Analyze > Compare Means > Independent-Samples T Test. Use the arrows to select a Test Variable (dependent variable), and Grouping Variable, which indicates which of two samples an observation belongs in.
 You need to tell SPSS which group is which. Click on the Grouping Variable so it is highlighted in yellow, then click on the Define Groups... button. If you don't know the values of your grouping variable, see
  Enter in a value for Group 1 and Group 2, under "Use specified values." (If you don't know what the values of the variable are, you can make a frequency table using Analyze > Descriptive Statistics > Frequencies). Then click Continue, then OK.
 Move one variable under Variable1, and the other under Variable2, on one line of the Paired Variables sections.
 The p value is in the circled area.
 Move the continuous variable into the Dependent List, and the grouping variable into the Factor field, using the arrows in the center of the menu.
 For the Tukey-Kramer test, click on Post Hoc... and check the box next to Tukey. Then click Continue, then OK.
 The p value is in the circled area.
 Navigate to Analyze > Compare Means > One-Way ANOVA. Move the continuous variable into the Dependent List, and the grouping variable into the Factor field, using the arrows in the center of the menu. Then click on Options...
 Check the box next to Welch. Then click Continue, then OK.
 The p value is in the circled area.
 Navigate to Analyze > General Linear Models > Univariate. Move your dependent (numerical) variable in the Dependent Variable list, and your two independent (categorical variables) in the Fixed Factors list.
 Click on the Options... button, then move everything under Factors and Factor Interactions to Display Means For. Check the box under Display for Descriptive Statistics and Homogeneity Tests. (This will give you Levene's homogeneity of variance test.) Click continue, then OK.
 The circled areass, under "Sig." indicate whether either of the independent variables, or their interaction, has a statistically significant effect on the dependent variables.
 Navigate to Analyze > Nonparametric > Legacy Dialogs > 2 Independent Samples. (Mann-Whitney U is the default Test Type.) Use the arrows to select a Test Variable (independent variable), and Group Variable, which indicates which of two samples an observation belongs in.
 Enter in a value for Group 1 and Group 2, under "Use specified values." Then click Continue, then OK. If you don't know the values of your grouping variable, first see
  The p value is in the circled area.
 Navigate to Analyze > Nonparametric > Legacy Dialogs > K Independent Samples. (Kruskal-Wallis should be the default test.) Use the arrows to select a Test Variable (independent variable), and Grouping Variable, which indicates which sample an observation belongs in.
 You need to tell SPSS which group is which. Click on the Grouping Variable so it is highlighted in yellow, then click on the Define Range... button.
  Enter in values for Minimum and Maximum, under "Range for Grouping Variable." These are the lowest and highest values of the grouping variable that you want to include. If you don't know the possible values, you can create a frequency table of your grouping variable using Analyze > Descriptive Statistics > Frequencies. Then click Continue, then OK.
 The p value is in the circled area. The test statistic is the number next to "chi square."
 Navigate to Analyze > Regression > Linear. Use the arrow buttons to move your dependent and independent variables into their respective fields, then click OK.
 To check for heteroscedasticity, before running the linear regression click on the Plots... button in the upper right. You can make a scatterplot of the residuals and the predicted values of your regression by moving *ZRESID (standardized residuals) into the Y field, and *ZPRED (standardized predicted values) into the X field, then click Continue and OK. The scatterplot will be created along with the statistical output.
 To add a horizontal line at 0 after you've made this chart, double-click on the chart in the Output window to open up the Chart Editor. In the Chart Editor, click on Options > Y Axis Reference Line. This opens the Properties window; from here, under the "Reference Line" tab, enter a 0 in the Position field. Then click Apply and the line will appear in your chart. Close the Chart Editor and you will see that the chart in the Output window now has the horizontal line. (This works for other charts as well.)
 Navigate to Analyze > Correlate > Bivariate. Move your two variables into the Variables box, using the arrow button. Make sure that the box next to "Pearson" is checked under Correlation Coefficients, and click on the box next to "Flag significant correlations."
 The output is contained in four boxes. The top right and bottom left boxes should be identical, and contain the useful information. The p value is in the circled area, and the test statistic, r in this case, is shown next to "Pearson Correlation."
 Navigate to Analyze > Correlate > Bivariate. Move your two variables into the Variables box, using the arrow button. Make sure that the box next to Spearman is checked under Correlation Coefficients, and click on the box next to "Flag significant correlations."
 The output is similar to the output shown above for linear correlation.
 Navigate to Analyze > General Linear Model > Univariate. Use the arrow button to move the dependent variable into the Dependent Variable field. Then move categorical (scale) variables into the Fixed Factor(s) field, and continuous numeric independent variables into the Covariate(s) field.
 In order to specify your own interaction terms, in the Model menu under "Specify Model," click on the button next to Custom.